公司要做阿里的小程序接入,需要通过测试,测试呢需要提供硬盘的监控报告,比如 iops 。
同事从网上找了一下,iops 监控原文如下:监控磁盘的 iops ,利用 linux 的 /proc/diskstats 的第四个字段和第八字段可监控读和写的 iops,第四个记录是记录所有读的次数,第八个字段是记录所有写的次数。通过 zabbix 上的差速率即可监控磁盘的 iops。
文章链接:https://cloud.tencent.com/developer/article/1519113?ivk_sa=1024320u
仔细研究了一下上面的文章,看了它提供了两张监控图,分析一下:
第一张图:

有两个指标,绿色的是硬盘每秒的 io 读次数,红色的是硬盘每秒的 io 写次数。
第二张图:
 同样两个指标,绿色的是硬盘每秒的 io 读 Bytes,红色的是硬盘每秒的 io 写 Bytes。
知道了指标具体的含义,这样就好办了。
我们用的是 prometheus 和 node_exporter
首先去看看 node_exporter 暴露的指标,搜一搜 node_disk,会看到如下4个指标:
 1# HELP node_disk_reads_completed_total The total number of reads completed successfully.
 2# TYPE node_disk_reads_completed_total counter
 3node_disk_reads_completed_total{device="sda"} 4.9530358e+07
 4# HELP node_disk_writes_completed_total The total number of writes completed successfully.
 5# TYPE node_disk_writes_completed_total counter
 6node_disk_writes_completed_total{device="sda"} 1.4449267304e+10
 7
 8# HELP node_disk_read_bytes_total The total number of bytes read successfully.
 9# TYPE node_disk_read_bytes_total counter
10node_disk_read_bytes_total{device="sda"} 6.4101677568e+11
11# HELP node_disk_written_bytes_total The total number of bytes written successfully.
12# TYPE node_disk_written_bytes_total counter
13node_disk_written_bytes_total{device="sda"} 1.15483858333184e+14
可以看出是上面 4 个指标,这四个指标都是 counter 计数器类型的,都是只增不减的。
然后去 prometheus ,画个图试试,query 分别如下(注意我们的 instance 即 node_exporter,是跑在了 50000 端口,是非标准的):
1node_disk_reads_completed_total{instance="192.168.1.1:50000"}
2node_disk_writes_completed_total{instance="192.168.1.1:50000"}
3
4node_disk_read_bytes_total{instance="192.168.1.1:50000"}
5node_disk_written_bytes_total{instance="192.18.1.1:50000"}
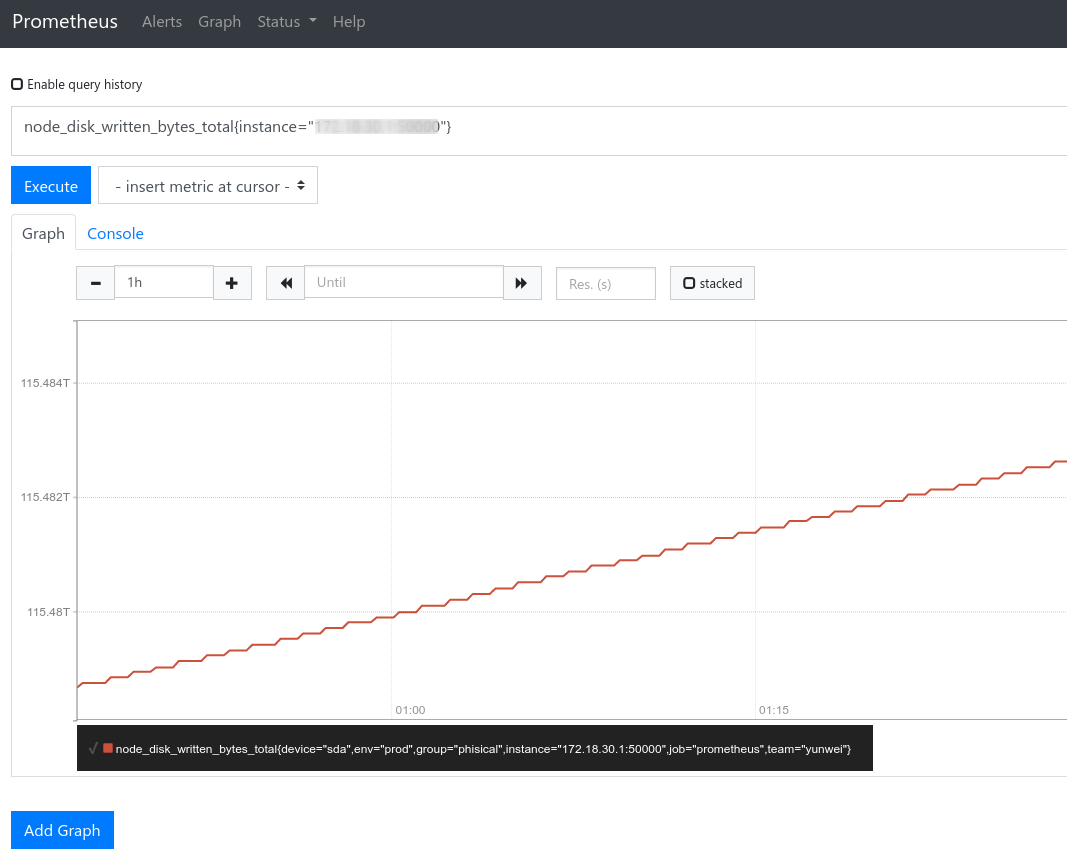
大家看到了 counter 类型,必然是一条斜线直冲天际。
好了,我们然后去 grafana 里增加面板:

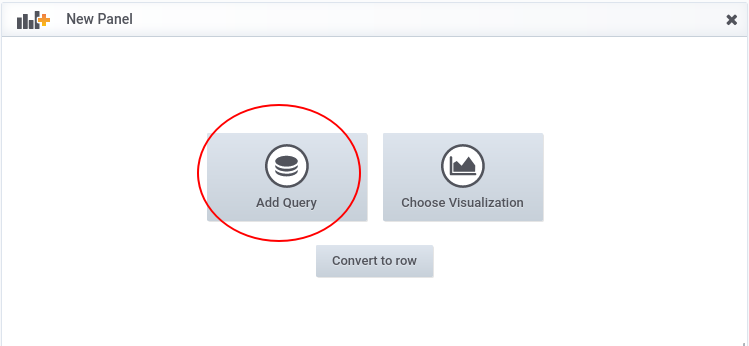
选 Add Query
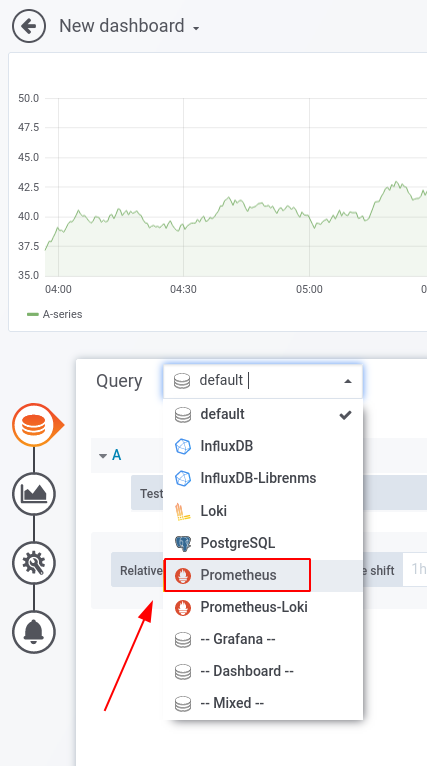
先选数据源,选择系统中已经配好的 prometheus,怎么配这里就不说了:
然后在 Query 的 Metrics 里填入 node_disk_written_bytes_total{instance="192.168.1.1:50000"}:
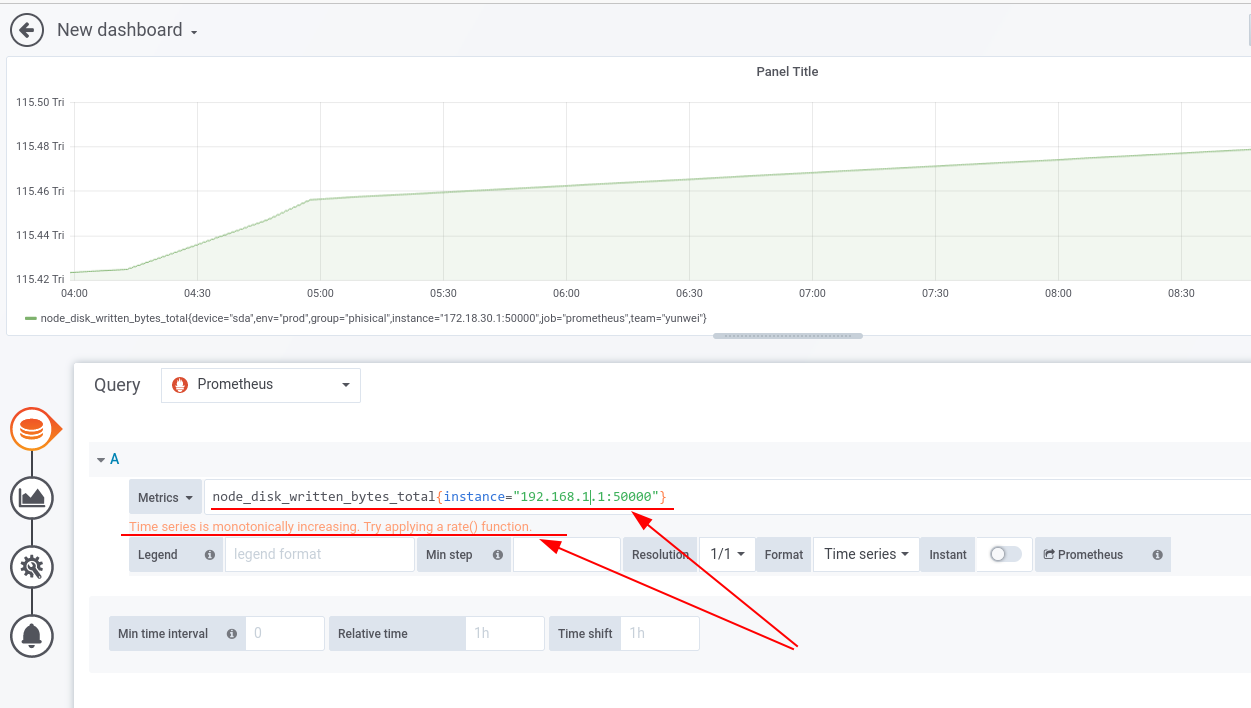 在 Legend 的空白处随便点一下,大折线出现了,而且给出了提示:Time series is monotonically increasing. Try applying a rate() function.
听人劝,吃饱饭。我们改一下 Metrics 的查询语句,因为我们是5分钟抓一次数据,所以改成如下格式: rate(node_disk_written_bytes_total{instance="192.18.1.1:50000"}[5m])
再增加一个查询,Add Query 同时把 read bytes 和 write bytes 放进一张图去:
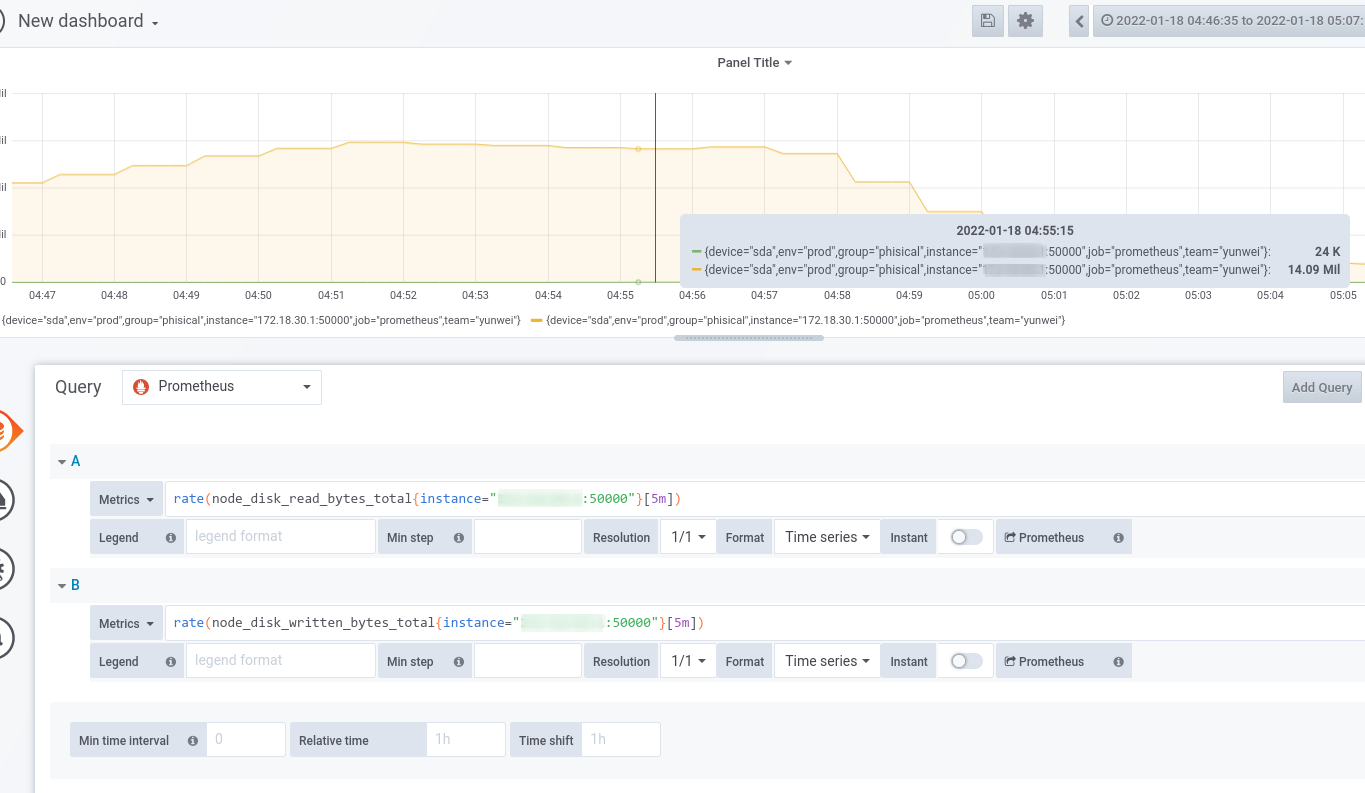
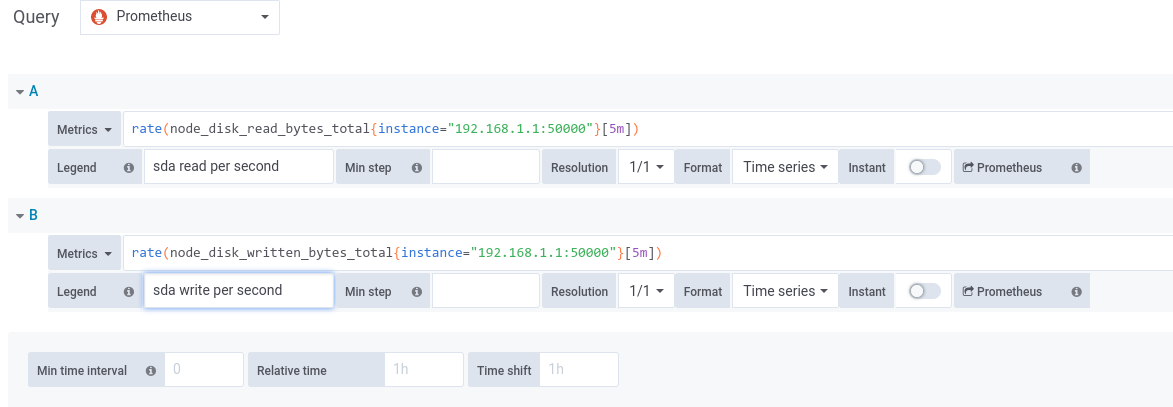
最后修正一下:
1A:
2Metrics: rate(node_disk_read_bytes_total{instance="192.168.1.1:50000"}[5m])
3Legend: sda read per second
4
5B:
6Metrics: rate(node_disk_written_bytes_total{instance="192.168.1.1:50000"}[5m])
7Legend: sda write per second
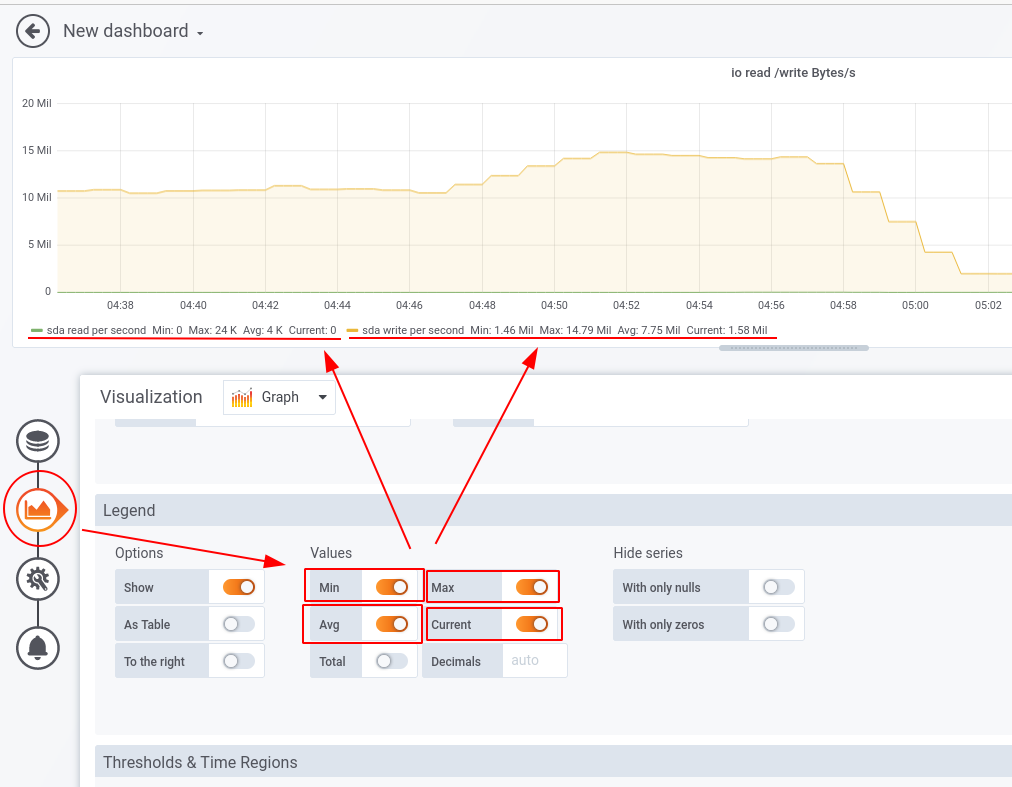
再把最大、最小、平均、当前给出来:
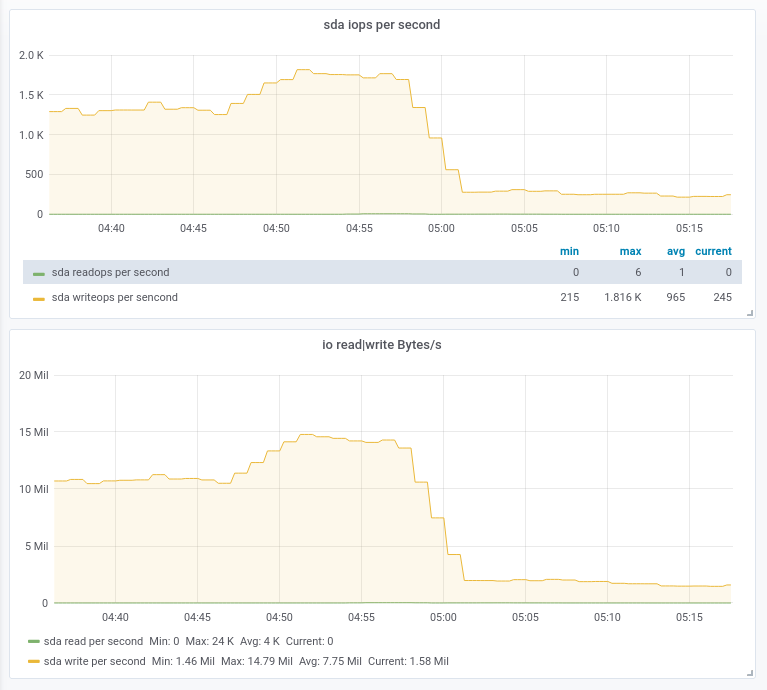
这样图就做好了,最后完工的两张图:
所有 prometheus 从各种 exporter 收上来的数据都可以这么图形化,以后画图就丰简由人了。

